Functions and classes in Python#
Author: Jeff Jennings (CCA, jjennings@simonsfoundation.org)
Functions#
Some common function syntax#
*args and **kwargs function arguments#
When it’s not known what arguments a function will receive, you can include *args (after all other arguments) to add an arbitrary number of positional arguments into a tuple, args:
[173]:
def func(x, y, *args):
  print(args)

func(1, 2, 3, 4, 'my_arg')
(3, 4, 'my_arg')
Similarly you can pass arbitrary keyword arguments into a function with **kwargs. All keyword arguments not specified in the function definition are packed into the dictionary kwargs:
[174]:
def func(x, y, **kwargs):
  print(kwargs)

func(1, 2, a=3, b=4)
{'a': 3, 'b': 4}
You can combine these, e.g. when calling a function that takes a lot of arguments:
[175]:
def func(a, b, c, x, y, z):
  print(a, b, c)
  print(x, y, z)

args = [1, 2, 3]
kwargs = {'x': 4, 'y': 5, 'z': 6}
func(*args, **kwargs)
1 2 3
4 5 6
lambda functions#
A lambda function is a type of anonymous function. The executable body of a lambda function must be an ‘expression’ (as opposed to a ‘statement’) – it can’t contain, e.g., loop blocks, conditionals or print statements. As a simple example:
[176]:
f = lambda x: x ** 2 + 2 * x + 5
f(2)
[176]:
13
The argument of 2 of f(2) was passed to x. You can have a lambda function with more than one argument:
[177]:
f = lambda x, y: x ** 2 + 2 * x * y + 5
f(2, 3)
[177]:
21
List comprehensions#
A list comprehension is a construct to create a list based on another iterable object in one line:
[178]:
xs = range(10)
squares = [x ** 2 for x in xs]
print(squares)
[0, 1, 4, 9, 16, 25, 36, 49, 64, 81]
This is faster and ‘neater’ than using a for loop:
[179]:
squares = []
for x in xs:
  squares.append(x ** 2)
print(squares)
[0, 1, 4, 9, 16, 25, 36, 49, 64, 81]
As a more complex example, a list comprehension can use an if statement:
[180]:
squares = [x ** 2 for x in xs if x % 2 == 0]
squares
[180]:
[0, 4, 16, 36, 64]
And it can do more complex mapping:
[181]:
squares = [x ** 2 if x % 2 == 0 else x for x in xs]
squares
[181]:
[0, 1, 4, 3, 16, 5, 36, 7, 64, 9]
List comprehensions can even be nested. For example, to flatten a list of lists:
[182]:
nested_list = [[1, 2, 3], [4, 5, 6], [7, 8, 9]]
print([element for sub_list in nested_list for element in sub_list])
# you can understand this by reading it as
# 'for sub_list in nested_list: for element in sub_list: element'

# written more succinctly, but less intuitively at first:
[e for l in nested_list for e in l]
[1, 2, 3, 4, 5, 6, 7, 8, 9]
[182]:
[1, 2, 3, 4, 5, 6, 7, 8, 9]
Sometimes list comprehensions can be confusing to read, and you end up understanding them by thinking through the equivalent for loop – use a for loop if it’s easier for you.
Exercise: turning some plotting code into a function#
We’ll start by getting the needed packages and files.
[183]:
import copy
import numpy as np
import matplotlib.pyplot as plt
import matplotlib.colors as mco
from astropy.visualization.mpl_normalize import simple_norm
from astropy.utils.data import download_file
[ ]:
# get the sky image used for the tutorial
as209_img = np.load('../_static/AS209_dirty_image.npy')
Cloning into 'short_tutorials'...
remote: Enumerating objects: 69, done.
remote: Counting objects: 100% (69/69), done.
remote: Compressing objects: 100% (58/58), done.
remote: Total 69 (delta 10), reused 51 (delta 6), pack-reused 0 (from 0)
Receiving objects: 100% (69/69), 4.86 MiB | 10.11 MiB/s, done.
Resolving deltas: 100% (10/10), done.
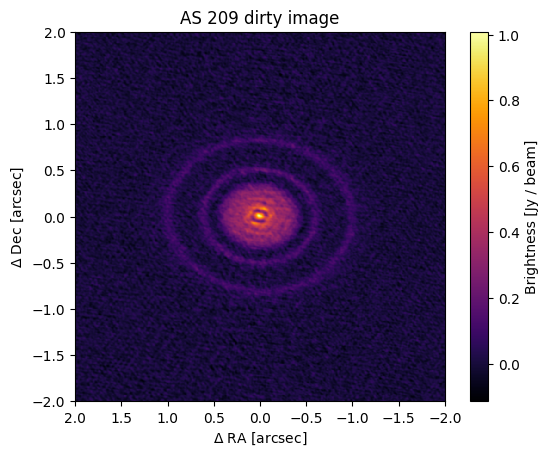
Convert the below code into a function:
[185]:
fig, ax = plt.subplots()

im = ax.imshow(
    as209_img,
    origin='lower',
    interpolation='none',
    extent=[2, -2, -2, 2],
    cmap='inferno',
    norm=None,
    )

ax.set_xlabel(r'$\Delta$ RA [arcsec]')
ax.set_ylabel(r'$\Delta$ Dec [arcsec]')
ax.set_title('AS 209 dirty image')

cbar = plt.colorbar(im, ax=ax)
cbar.set_label('Brightness [Jy / beam]')
Solution#
[186]:
def plot_image(
    image,
    extent,
    cmap="inferno", # several arguments can use sensible defaults
    norm=None,
    origin="lower",
    interpolation=None,
    ax=None, # if not passed in, an axis is generated by the function
    title=None,
    xlab=r"$\Delta$ RA [arcsec]",
    ylab=r"$\Delta$ Dec [arcsec]",
    clab=r"I [Jy / beam]",
):
    r"""
    Wrapper for plt.imshow, with a colorbar.

    Parameters
    ----------
    image : array
        2D image array.
    extent : list, len=4
        x- and y-extents of image: [x-min, x-max, y-min, y-max]
    cmap : str, default="inferno
        Matplotlib colormap.
    ...

    Returns
    -------
    im : Matplotlib imshow instance
        The plotted image.
    cbar : Matplotlib colorbar instance
        Colorbar for the image.
    """
    if ax is None:
        _, ax = plt.subplots()

    im = ax.imshow(
        image,
        origin=origin,
        interpolation=interpolation,
        extent=extent,
        cmap=cmap,
        norm=norm,
    )

    ax.set_xlabel(xlab)
    ax.set_ylabel(ylab)
    ax.set_title(title)

    cbar = plt.colorbar(im, ax=ax, location="right", pad=0.1)
    cbar.set_label(clab)

    return im, cbar
[187]:
im, cbar = plot_image(
    as209_img,
    extent=[2, -2, -2, 2],
    title="AS 209 dirty image",
    )
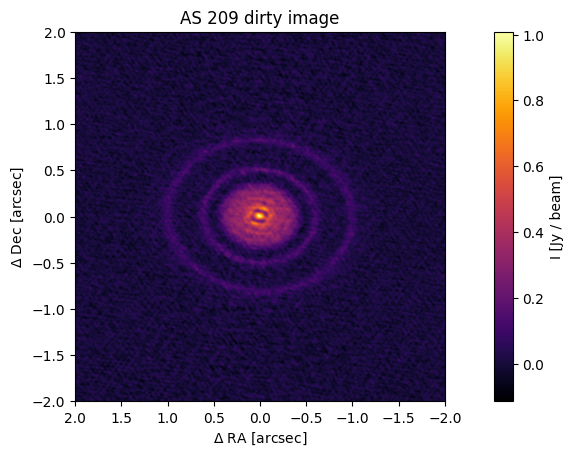
Compare the above few lines to the code we had when we didn’t use a function. The latter would need to be copy/pasted and slightly modified each time we want to make a plot, making the whole notebook much longer and harder to read. And if we change the block of code in one place in a notebook, we probably want to keyword search/replace everywhere…barf.
fig, ax = plt.subplots()

im = ax.imshow(
     as209_img,
     origin='lower',
     interpolation='none',
     extent=[2, -2, -2, 2],
     cmap='inferno',
     norm=None,
     )

ax.set_xlabel(r'$\Delta$ RA [arcsec]')
ax.set_ylabel(r'$\Delta$ Dec [arcsec]')
ax.set_title('AS 209')

cbar = plt.colorbar(im, ax=ax)
cbar.set_label('Brightness [Jy / beam]')
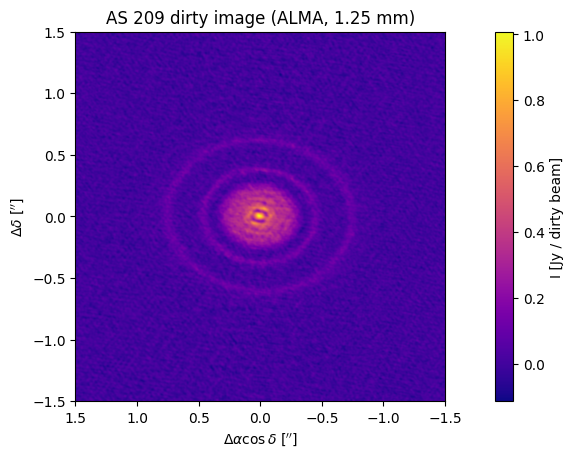
Going back to our function, if we want to change several of the default arguments, we could pass all of them in individually…
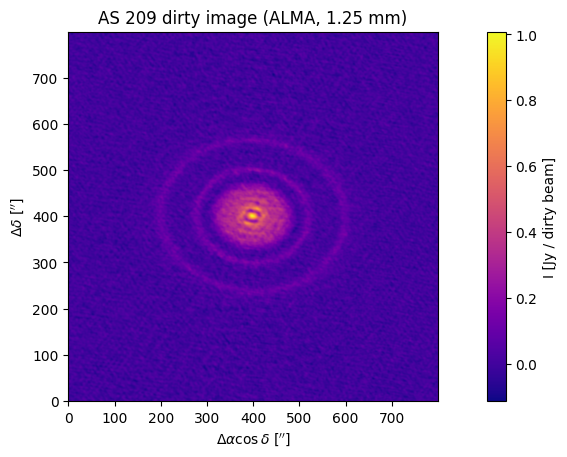
[188]:
# changing the values of several arguments:
im, cbar = plot_image(
    as209_img,
    extent=[1.5, -1.5, -1.5, 1.5],
    cmap="plasma",
    title="AS 209 dirty image (ALMA, 1.25 mm)",
    xlab=r"$\Delta \alpha \cos \delta$ [${}^{\prime\prime}$]",
    ylab=r"$\Delta \delta$ [${}^{\prime\prime}$]",
    clab=r"I [Jy / dirty beam]",
    )

…but we could also use what we learned about kwargs to simplify either the function call or the function itself.
Let’s first simplify the function call without changing the function; to do this, just make a dictionary of keyword arguments:
[189]:
# dictionary of keyword arguments, which could be saved for reference/re-use,
# or passed to something enclosing or calling our function, like a class
kw = {
    "cmap": "plasma",
    "norm": None,
    "origin": "lower",
    "interpolation": None,
    "ax": None,
    "title": "AS 209 dirty image (ALMA, 1.25 mm)",
    "xlab": r"$\Delta \alpha \cos \delta$ [${}^{\prime\prime}$]",
    "ylab": r"$\Delta \delta$ [${}^{\prime\prime}$]",
    "clab": r"I [Jy / dirty beam]",
    }

im, cbar = plot_image(
    as209_img,
    extent=[1.5, -1.5, -1.5, 1.5],
    **kw
    )
Alternatively to simplify the function itself, we can allow an arbitrary number of keyword arguments to be passed in, and group these arguments by how they’ll be used:
[190]:
def plot_image_simple(
    image,
    extent,
    ax,
    plot_kwargs,
    ax_kwargs,
    # the 2 kwargs arguments replaced all of:
    # cmap="inferno",
    # norm=None,
    # origin="lower",
    # interpolation=None,
    # ax=None,
    # title=None,
    # xlab=r"$\Delta$ RA [arcsec]",
    # ylab=r"$\Delta$ Dec [arcsec]",
    # clab=r"I [Jy / beam]",
):
    r"""
    Wrapper for plt.imshow, with a colorbar.

    Parameters
    ----------
    image : array
        2D image array.
    extent : list, len=4
        x- and y-extents of image: [x-min, x-max, y-min, y-max]
    ax : plt.axes instance
        Axis on which to plot
    plot_kwargs : dictionary
        Arguments passed to plt.imshow
    ax_kwargs : dictionary
        Arguments used to set axes labels

    Returns
    -------
    im : Matplotlib imshow instance
        The plotted image.
    cbar : Matplotlib colorbar instance
        Colorbar for the image.
    """
    if ax is None:
        _, ax = plt.subplots()

    im = ax.imshow(
        image,
        **plot_kwargs # using specifically the `plot_kwargs`
    )

    # using `ax_kwargs`
    ax.set_xlabel(ax_kwargs['xlab'])
    ax.set_ylabel(ax_kwargs['ylab'])
    ax.set_title(ax_kwargs['title'])

    cbar = plt.colorbar(im, ax=ax, location="right", pad=0.1)
    cbar.set_label(ax_kwargs['clab'])

    return im, cbar
[191]:
# separting kwargs into those passed to `plt.imshow` and those used to add plot labels
plot_kw = {
    "cmap": "plasma",
    "norm": None,
    "origin": "lower",
    "interpolation": None,
    }

ax_kw = {
    "title": "AS 209 dirty image (ALMA, 1.25 mm)",
    "xlab": r"$\Delta \alpha \cos \delta$ [${}^{\prime\prime}$]",
    "ylab": r"$\Delta \delta$ [${}^{\prime\prime}$]",
    "clab": r"I [Jy / dirty beam]",
    }

im, cbar = plot_image_simple(
    as209_img,
    extent=[1.5, -1.5, -1.5, 1.5],
    ax=None,
    plot_kwargs=plot_kw,
    ax_kwargs=ax_kw,
    )
Classes#
Some common class syntax#
self, the __init__ function, and a basic class structure#
A class is defined using the class keyword and indenting a subsequent the body of statements - attributes (variables) and methods (functions). Class names should have FirstWordsCapitalized.
An instance of a class can be initialized in a certain way (e.g., by setting attributes with given values) using the special method __init__, which takes any arguments, args, passed in when the class is called.
Class methods (functions) are defined using def keyword, but the first argument to each is the same variable, self, which refers to the object itself when it wants to call its own methods or refer to its own attributes.
[192]:
class BankAccount:
  """ An abstract base class representing a bank account"""
  # a *class* variable (shared by all instances of the class)
  currency = '$'

  def __init__(self, customer, account_number, balance):
    """
    Initialize the BankAccount class with a customer, account number
    and opening balance (which defaults to 0.)
    """
    # some *instance* variables (unique to each class instance)
    self.customer = customer
    self.account_number = account_number
    self.balance = balance

    # a private (internal) attribute
    self._used_for_lobbying = self.balance - 1

  def deposit(self, amount):
    """ Deposit amount into the bank account."""
    if amount > 0:
      self.balance += amount
    else:
      print(f"Invalid deposit amount: {amount}")

  def withdraw(self, amount):
    """
    Withdraw amount from the bank account, ensuring there are sufficient funds.
    """
    if amount > 0:
      if amount > self.balance:
        print("Insufficient funds")
      else:
        self.balance -= amount
    else:
      print(f"Invalid withdrawal amount: {amount}")
Now let’s create an instance of the class and access one of its attributes:
[193]:
my_account = BankAccount('Dr. Spaceman', 123456789, 1000)
print(f"balance {my_account.balance}")

# let's update `balance`
my_account.deposit(100)
print(f"balance after deposit {my_account.balance}")

# we can also access the 'private' variables, though presumably they're not meant
# to be user-facing
print(f"nothing to see here...{my_account._used_for_lobbying}")
balance 1000
balance after deposit 1100
nothing to see here...999
Class inheritance#
Classes can inherit from ‘parent’ classes – called ‘subclassing’. For example, BankAccount could be subclassed by a class for a savings account:
[194]:
class SavingsAccount(BankAccount):
  """ A class representing a savings account """

  def __init__(self, customer, account_number, interest_rate, balance=0):
    """ Initialize the savings account. """
    self.interest_rate = interest_rate
    super().__init__(customer, account_number, balance)

  def add_interest(self):
    """ Add interest to the account at the rate self.interest_rate """
    self.balance *= (1. + self.interest_rate / 100)
We did a few new things here. The SavingsAccount class adds a new attribute, interest_rate, and a new method, add_interest, to its base class. It also overrides the __init__ method to allow interest_rate to be set when a SavingsAccount is instantiated.
The new __init__ method calls the base class’ __init__ method in order to set the other attributes – the built-in function super allows us to refer to the parent base class.
Exercise: write an image plotting class#
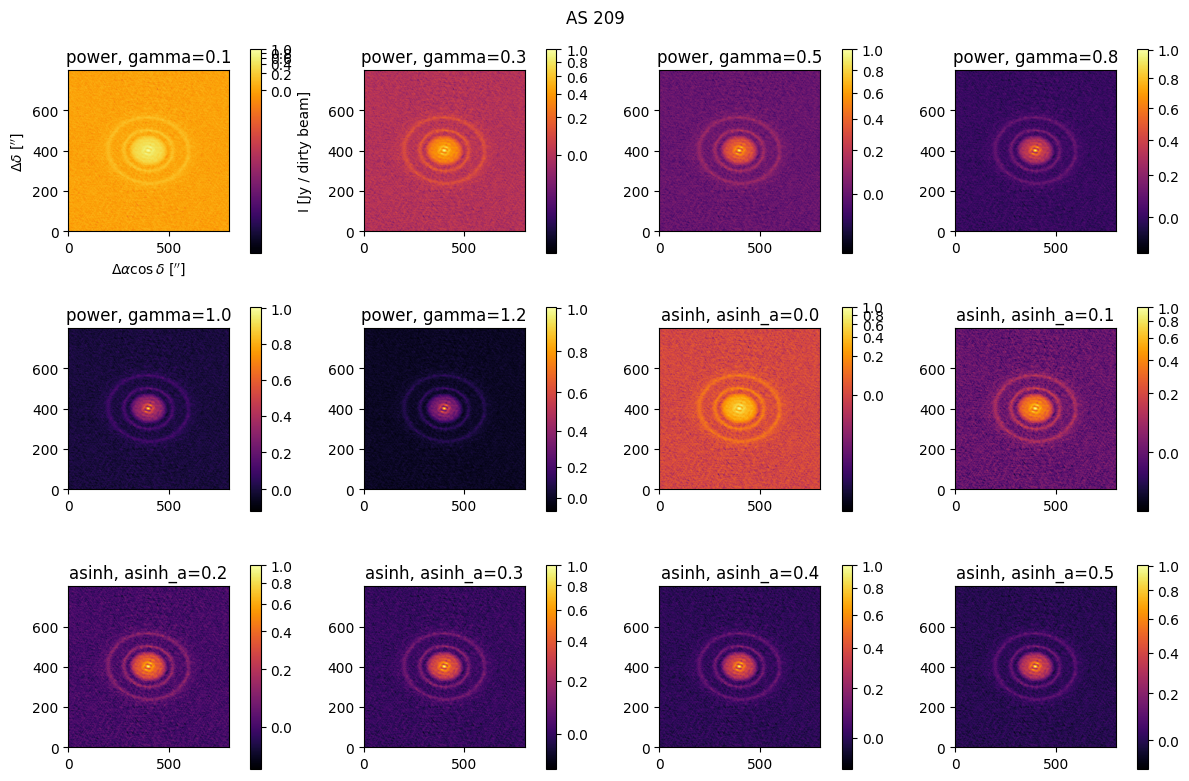
Write a class that contains your image plotting function, the below function for setting a colormap normalization, and a function that wraps (or rewrites) the below ‘loose’ code, which creates a multi-panel figure that plots the image with different colormap normalizations.
[195]:
# function to set a colormap normalization.
# move this function internal to your class.

def get_image_cmap_norm(image, stretch="power", gamma=1.0, asinh_a=0.02,
                        symmetric=False):
    """
    Get a colormap normalization to apply to an image.

    image : array
        2D image array.
    stretch : string, allowed ['power', 'asinh'], default = 'power'
        Transformation to apply to the colormap. 'power' is a
        power law stretch; 'asinh' is an arcsinh stretch.
    gamma : float, default = 1.0
        Index of power law normalization (see matplotlib.colors.PowerNorm).
        gamma=1.0 yields a linear colormap.
    asinh_a : float, default = 0.02
        Scale parameter for an asinh stretch.
    symmetric : bool, default=False
        Whether the colormap is symmetric about 0
    """
    if stretch not in ['power', 'asinh']:
        raise ValueError(f"'stretch' {stretch} is not supported.")

    if symmetric is True:
        vmax = max(abs(image.min()), image.max())
        vmin = -vmax

    else:
        vmax, vmin = image.max(), image.min()
        # if stretch == "power":
        #     vmin = 0

    if stretch == "power":
        norm = mco.PowerNorm(gamma, vmin, vmax)

    else:
        norm = simple_norm(
            image, stretch="asinh", asinh_a=asinh_a, vmin=vmin, vmax=vmax
        )

    return norm
[196]:
# loose code to make a multi-panel figure.
# turn this into a function internal to the class.

npanels = 12
fig, axs = plt.subplots(nrows=3, ncols=4, figsize=(12, 8))
axs = axs.flatten()
fig.suptitle('AS 209')

gammas = np.linspace(0.1, 1.2, int(npanels / 2))
asinh_as = np.linspace(0.01, 0.5, int(npanels / 2))

plot_kw = {
      "cmap":"inferno",
      "norm":None,
      "origin": "lower",
      "interpolation": None,
      }

ax_kw = {
      "title": "AS 209 dirty image (ALMA, 1.25 mm)",
      "xlab": r"$\Delta \alpha \cos \delta$ [${}^{\prime\prime}$]",
      "ylab": r"$\Delta \delta$ [${}^{\prime\prime}$]",
      "clab": r"I [Jy / dirty beam]",
      }

for nn, ax in enumerate(axs):
  p_kw = copy.deepcopy(plot_kw)
  a_kw = copy.deepcopy(ax_kw)

  # updating existing dict entries
  gamma = asinh_a = None

  if nn < npanels // 2:
    stretch = 'power'
    gamma = gammas[nn]
    a_kw['title'] = f"{stretch}, gamma={round(gamma, 1)}"

  else:
    stretch = 'asinh'
    asinh_a = asinh_as[nn - npanels // 2]
    a_kw['title'] = f"{stretch}, asinh_a={round(asinh_a, 1)}"

  norm = get_image_cmap_norm(
      as209_img,
      stretch=stretch,
      gamma=gamma,
      asinh_a=asinh_a,
      )

  # add a new dict entry
  p_kw['norm'] = norm

  if nn != 0:
    a_kw['xlab'] = a_kw['ylab'] = a_kw['clab'] = None

  # this function call is the same as above, even though we added the 'norm' kwarg
  im, cbar = plot_image_simple(
      as209_img,
      extent=[1.5, -1.5, -1.5, 1.5],
      ax=ax,
      plot_kwargs=p_kw,
      ax_kwargs=a_kw,
      )

fig.tight_layout()