Profiling and accelerating Python code#
Profiling Python code with cProfile#
Author: Philip Mocz (CCA, pmocz@simonsfoundation.org)
[ ]:
import numpy as np
%load_ext snakeviz

# `%snakeviz%` will first profile a line or block of code
# by running cProfile, then run snakeviz to produce an
# interactive call stack that helps you identify bottlenecks
# (see https://jiffyclub.github.io/snakeviz/ for a more thorough explanation)
%snakeviz np.fft.fft(np.random.rand(10000))
You can also profile a Python script from the terminal, by first calling cProfile
python -m cProfile -o report.prof myCode.py
and then visualizing the result with SnakeViz
snakeviz report.prof
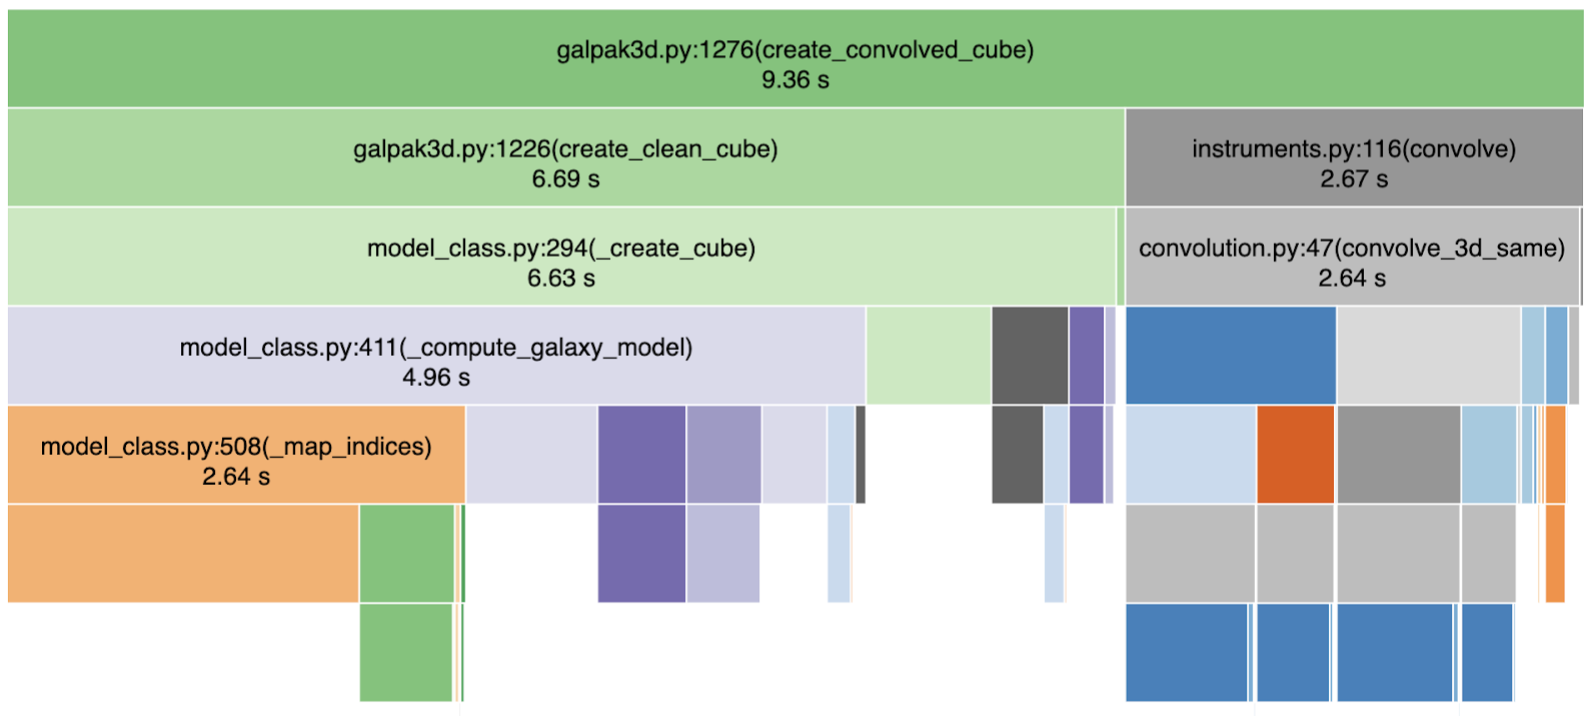
to easily get a report on a larger suite of code, like the below.
Accelerating Python code with Numba#
[2]:
# speed up your object-oriented Python code by adding a just-in-time compiled function with Numba
import numpy as np
import timeit
from numba import jit

class MyClass:
    def my_method(self, A, B):
        """Perform operations on A and B"""
        return self.heavy_duty(A, B)
    @staticmethod
    @jit(nopython=True)

    def heavy_duty(A, B):
        """Write your critical functions as 'pure' functions,
        i.e. perform operations on / return only numpy arrays"""
        return np.exp(A * B)


if __name__ == "__main__":
    np.random.seed(42)
    A = np.random.rand(1000, 1000)
    B = np.random.rand(1000, 1000)

    my_class = MyClass()

    # time function calls
    print("No Numba: ", timeit.timeit(lambda: A @ B, number=1000))
    print("With Numba: ", timeit.timeit(lambda: my_class.my_method(A, B), number=1000))
No Numba:  16.303466625045985
With Numba:  2.9970250001642853